|
|
|
|

|
|
|
Applications Note - COMBUSTION MONITORINGCAPABILITIESAFR has developed the methodology, hardware, and software to perform on-line and in-situ monitoring of combustion systems including:
DEMONSTRATED APPLICATIONSThe methods have been demonstrated for the measurements in utility boilers, pulp and paper recovery boilers, incinerators, and combustion research including:
METHODOLOGYFT-IR spectroscopy can be used for combustion monitoring in several ways. A sample can be extracted from any point in the furnace or stack using a probe. This sample can then be preconditioned (removal of water or particles, dilution with air) and analyzed in a gas cell at a user specified path length using absorption spectroscopy. Alternatively, in-situ measurements can be made along a line-of-sight through the furnace or stack using either absorption, emission or combined absorption/emission spectroscopy. Measurements of gas concentration are based on the absorption of radiation from an infrared source. Temperature can be obtained from gas band shapes (which reflect the population of vibrational and rotational energy levels) in absorption or in emission. Temperatures can also be obtained from a combination of emission and absorption. Particle size is obtained from radiation scattering by diffraction. Tomographic reconstruction of spectra for multiple lines-of-sight can be used to obtain spatially resolved spectra, from which analysis of temperature and concentration may be performed. Several of these measurement methods have been successfully employed in commercial industrial plants under harsh conditions. RESULTSFT-IR Line-of-Sight Transmission Analysis in a Smoke Stack of a Pulp and Paper Mill Recovery BoilerTransmission measurements were made across a 5 meter diameter smoke stack of an operating recovery boiler. Results for the quantitative analysis are presented in Table 1. Most species can be observed at the ppm level, even with the high concentrations of water. The uncertainties for these measurements are mainly due to the high water concentrations. Similar quantitation performed on spectra with no water have extremely low uncertainties for the gases in the table (< 0.05 ppm). The concentration of NO and NO2 were in good agreement with the total NOx concentration, determined by an extractive measurement. The negative value for CH4 indicates that there was more CH4 in the air outside the stack (where the reference was taken) than in the stack itself.
Table 1:. Gas concentrations from a Black Liquor Recovery Boiler. To improve quantitation in the presence of interfering species, AFR has developed a method which employs a library spectrum and a library perturbation spectrum which includes features which vary with pressure, concentration or temperature. Figure 1 shows time lines for the quantitation of CH4, CO2, CO, and Water.
Figure 1. Computer screen showing effect of quantitative algorithm applied to 10 ppm of NO in the presence of 1000 - 10000 ppm H2O in 1 atmosphere of air at 30°C. a) Single H2O reference, b) H2O reference and perturbation reference.
FT-IR Emission/Transmission Measurements in a Pulp and Paper Mill Recovery Boiler Absorption and emission measurements were made directly across a black liquor recovery boiler itself. Typical results are presented in Fig. 2. Although the eye cannot see through the fume because of scattering in the visible region of the spectrum, Fig. 2a shows that the stream is not opaque to the IR beam. The spectrum contains opaque regions because of the absorptions by CO2 (2350 cm-1), H2O (3500 cm-1 and 1600 cm-1), and the fume (1200 cm-1). The absence of a strong absorption near 2143 cm-1 (the CO region) indicates that the boiler is operating fairly efficiently.
Figure 2. Tests of an FT-IR monitor on the recovery boiler of a paper mill revealed that for sub micron fume particles, scattering decreased rapidly with decreasing wavenumber (a), creating partially transparent windows in the spectrum. The experiment also demonstrated that a set of temperature measurements could be derived from the radiance spectrum (b) and from the normalized radiance (c) with a gas temperature of 1140 K, wall temperature of 980 K, and cold gas temperature of 700 K. A set of temperature measurements can be derived from the radiance spectrum (Fig. 2b) and the normalized radiance (Fig. 2c). The sharp notch in the radiance near 2400 cm-1 is due to cold CO2 outside the boiler absorbing the hot CO2 radiation. However, at both edges of the band, the radiation from hot CO2 is not absorbed by the cold CO2, and these regions can be used to determine the hot CO2 temperature. Figure 2c shows that several temperatures are present. The 1140 K black body curve fits the gas absorptions for CO2 and H2O, and the fume absorption. This is the gas temperature inside the furnace. The 700 K curve fits the cold CO2 band and identifies the temperature near the boiler optical access port. The radiance at high wavenumbers is due to fume scattering of the wall radiation. We find that a temperature of 980 K (Fig. 2c) is in agreement with the estimated wall temperature. The fume particle size can be derived from the absorption spectra. By fitting the fume absorption and scattering derived using Mie theory, one finds that the 0.2 µm particle size is incorrect because the fume absorption features are too large to be consistent with the observed scattering spectrum. Similarly, a 0.6 µm particle size is also incorrect since it predicts absorption peaks that are too small to fit the measured scattering spectrum. The best fit is clearly a 0.4 µm particle size in agreement with measurements on captured fume particles.
FT-IR Measurements in Power Plants Both in-situ and extractive FT-IR measurements were performed during field tests at a Cogentrix coal-fired cogeneration plant (Richmond, VA). Urea injection is used at two locations in the furnace to control NOx formation. For extractive FT-IR measurements, the flue gas was sampled prior to the lime spray dryer, using an STI Dilution Probe (Graseby/STI, Waldron, AR). In general, the FT-IR measurements were in reasonable agreement with those of the resident CEM systems. In-situ FT-IR spectra were collected across a 2.34-meter duct directly after the economizer section. The operating conditions at this site were very harsh; the ambient temperature was in excess of 73°C (110°F) and vibrations were significant. In spite of this, the system performed well for three full days of testing. Both NH3 and HCl were measured, and were consistent with changes in the boiler operating conditions. Clearly, the ability to determine NH3 concentrations on a short time scale (< 30 seconds) will be very useful in the control of urea injection used for NOx reduction.
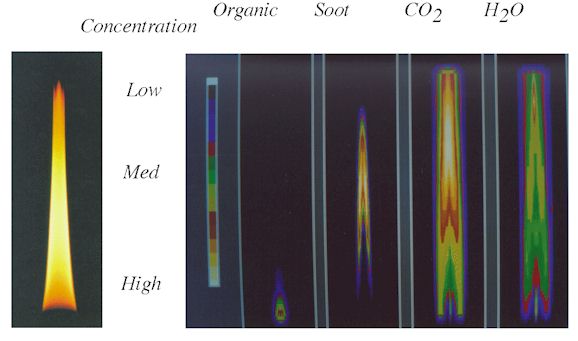
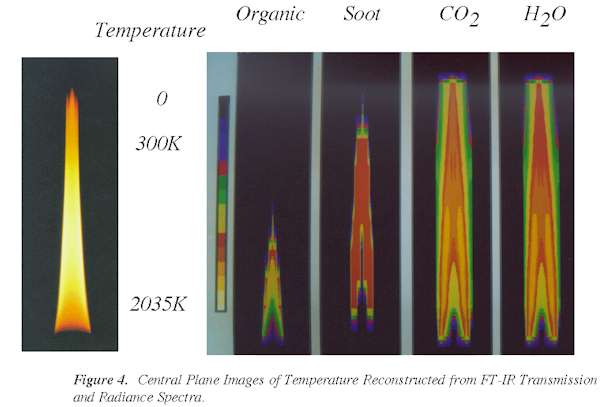
Tomography For non-homogeneous samples, measurements of emission and transmission will yield an average across the line-of-sight. Alternatively, it is possible to employ tomography to obtain spatially resolved data. Tomography refers to the construction of a three dimensional image by stacking up two-dimensional slices of the image. The two-dimensional images can be mathematically "reconstructed" from line-of-sight measurements across the object. We have employed tomography for both transmission and emission spectra for an ethylene diffusion flame. For the absorbance spectra, a Fourier reconstruction of the two-dimensional images from the projections has been performed. For radiance, the spectra were corrected for self-absorption. The Fourier reconstruction technique was then applied to these corrected radiation spectra to give local radiance. The analysis of these local spectra has been performed in the same manner as for thin homogeneous samples as described above. Plots showing the concentrations and temperatures in the center plane of the flame are presented in Figs. 3 and 4. A photograph of the flame is shown alongside reconstructed images (color scale) of organics, soot, CO2, and H2O. FT-IR tomography has thus demonstrated the unique capability of measuring local species concentrations and temperatures in mixed phase systems.
Figure 3. The Ethylene Diffusion Flame with Central Plane Images of Relative Concentration Reconstructed from FT-IR Transmission.
Figure 4. Central Plane Images of Temperature Reconstructed from FT-IR Transmission and Radiance Spectra.
|
|
For More Information Contact: This web site was designed and created by Karin Dutton, Advanced Fuel Research, Inc. |